Menu
Math Lesson 10.3.1 - Graphing First Order Inequalities with One Variable
Please provide a rating, it takes seconds and helps us to keep this resource free for all to use
Welcome to our Math lesson on Graphing First Order Inequalities with One Variable, this is the first lesson of our suite of math lessons covering the topic of Graphing Inequalities, you can find links to the other lessons within this tutorial and access additional Math learning resources below this lesson.
Graphing First Order Inequalities with One Variable
Let's begin to explain how to graph the inequalities with the simplest type of inequalities - the first order inequalities with one variable. We learned in tutorial 10.1 that we have four possible inequalities of this type:
ax + b ≥ 0
ax + b < 0
and
where a and b are numbers and x is the variable.
Again, we will use the first-order equation with one variable
as a boundary line for the corresponding linear inequalities with one variable deriving from it (the four ones shown above).
From the previous tutorials, it is clear that the graph of a first-order equation with one variable represents a vertical line, as the graph concerns only the position of the coordinate x in a number line. Hence, when we represent graphically this type of equation on a XY coordinate system, it shows a vertical line because the y-coordinate does not matter. Look at the graph below.
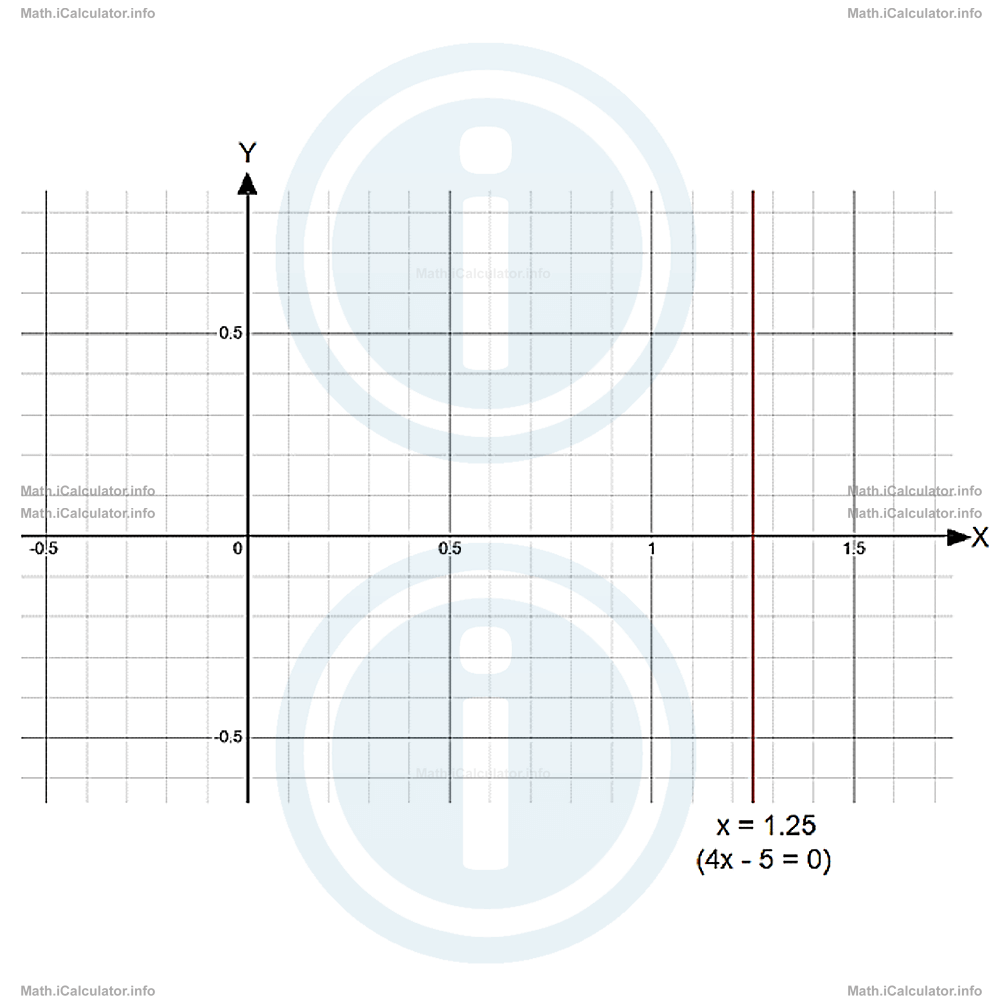
The graph shows the equation 4x - 5 = 0, where a = 4 and b = -5. From theory, we know that such equations have a general solution given by
In the specific case, this solution is equal to
= 5/4
= 1.25
as shown in the graph.
Now, let's explain what we obtain when the solutions of the four inequalities deriving from the above equation are required. Thus, if we want to graph the inequality
First, we must isolate the variable x. Thus, taking the coefficient a as positive to avoid changes in the inequality sign, yields
ax > -b
x > -b/a
In our example, we have
4x > 5
x > 5/4
This means all solutions of this inequality extend to the right of the above value, as shown in the figure.
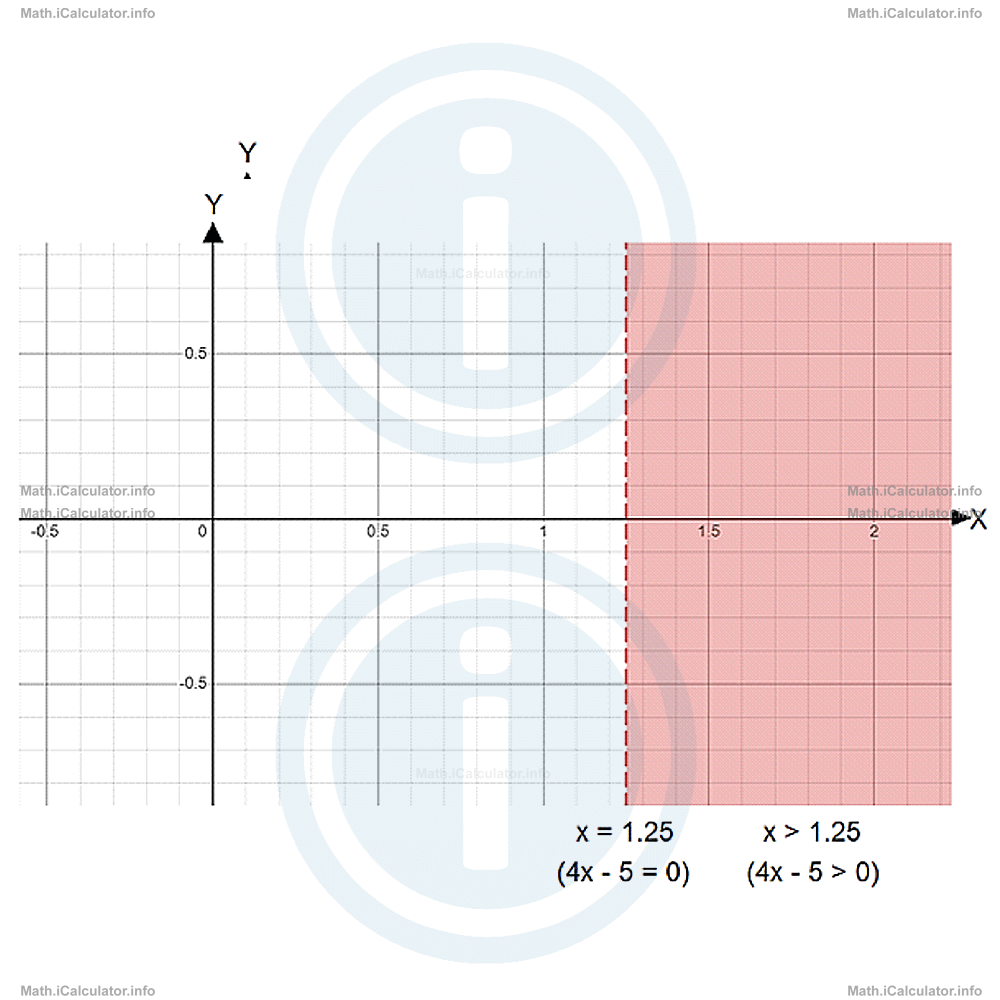
In this way, it is obvious that the solution set of the inequality
extends to the right of the vertical line
In the figure above, this solution set is shown by the coloured zone that extends on the right of the line x = 1.25.
The dashed line shows that the value x = 1.5 does not belong to the solution set of this inequality, as implied from the sign " > " of the original inequality, which excludes the boundary value as a solution. Hence, we obtain the following rule for this type of inequality:
In linear inequalities of the form ax + b > 0, the solution set represents all values to the right of the boundary value x = -b/a, without including it.
If the original inequality was
instead, i.e. if the solution set was
the solution set would also include the vertical line (the boundary line) that shows the equation 4x - 5 = 0 (i.e. x = 1.25). In this case, the boundary line is not dashed but solid instead, as shown below.
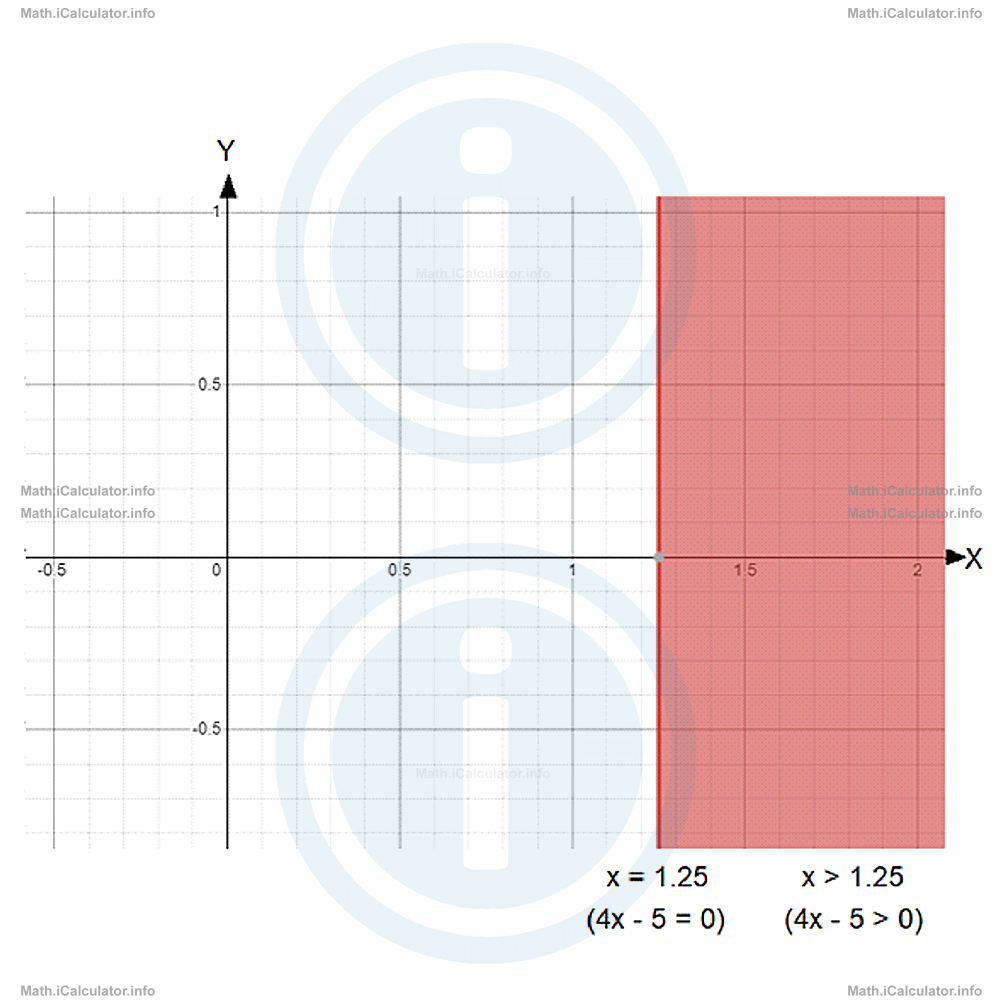
In this way, we reach the following conclusion about the linear inequality with one variable
In linear inequalities of the form ax + b ≥ 0, the solution set represents all values to the right of the boundary value x = -b/a, including it.
Now, let's see what happens if we have to solve graphically the linear inequality with one variable
The general solution for this inequality is
ax < -b
x < -b/a
which includes all values on the left of the point
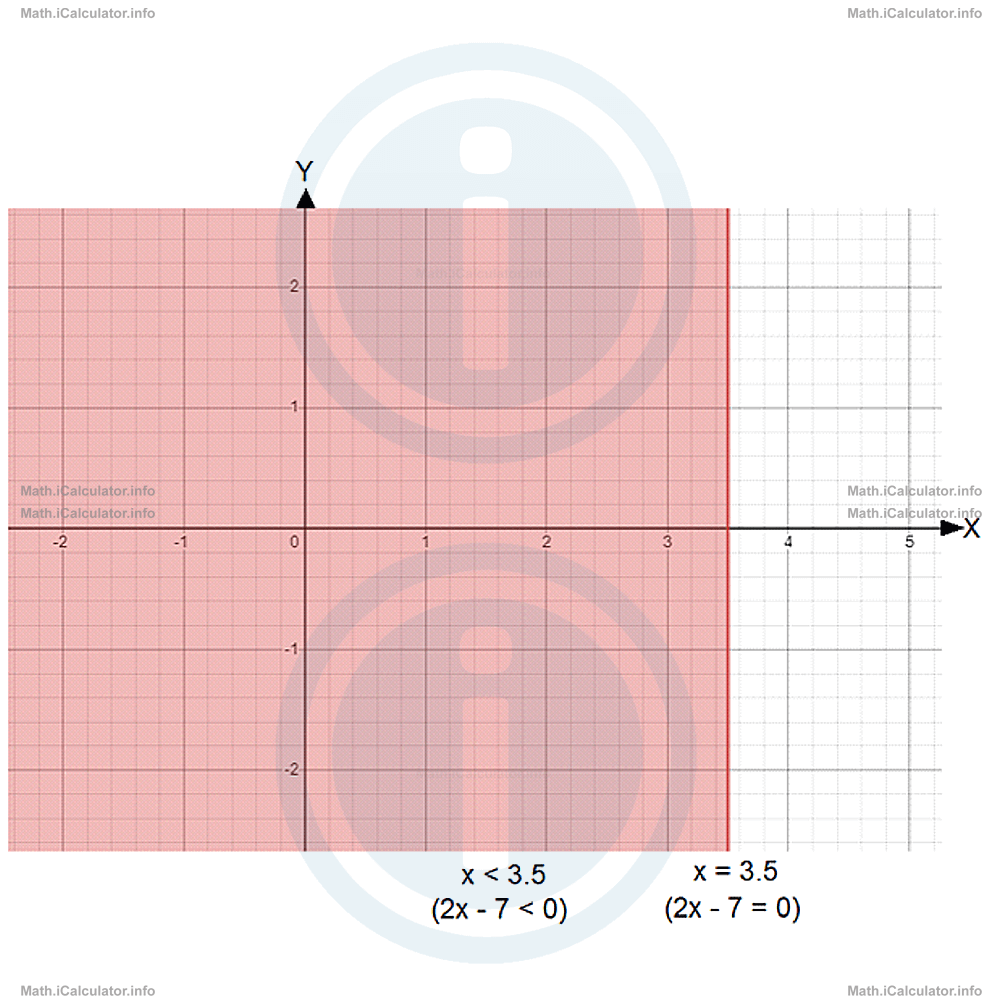
without including it. Therefore, the boundary line x = -b/a is dashed when shown graphically. For example, in the first-order inequality with one variable
the solution set includes all values that are smaller than 3.5 (x < 3.5), as
2x < 7
x < 7/2
x < 3.5
When shown graphically, this solution set includes all values on the left of x = 3.5, and the corresponding boundary line is dashed, as the value 3.5 does not belong to the solution set of the original inequality. Look at the figure.
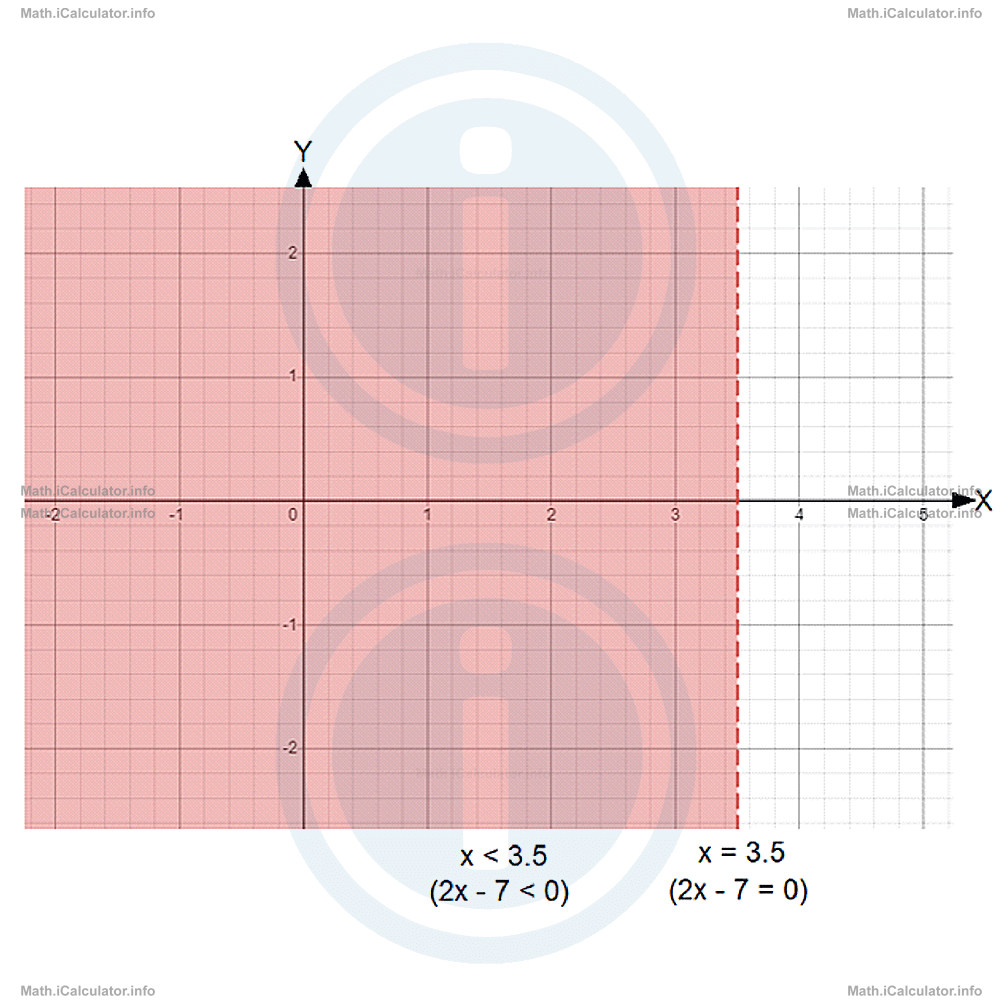
In this way, we obtain the following rule for such inequalities:
In linear inequalities of the form ax + b < 0, the solution set represents all values to the left of the boundary value x = -b/a, without including it.
Last, if we have to solve graphically the linear inequality with one variable
the solution set contains all values on the left of the boundary value x = -b/a including this one, as there is the combined inequality sign " ≤ " involved, which means the original inequality must be less than or equal to zero. For example, the solution set of the inequality
includes all values from 3.5 to its left. Therefore the boundary value x = 3.5 is shown by a solid vertical line when solving graphically this inequality. Look at the figure.
Hence, we obtain the following general rule for this case:
In linear inequalities of the form ax + b ≤ 0, the solution set represents all values to the left of the boundary value x = -b/a, including it.
Example 1
Solve graphically the following inequalities and make the proof by taking one value of the variable from the solution set and another value outside the solution set.
- 1 > -4x
- -3x ≥ 6
Solution 1
- First, we must write this inequality in the standard form. We have 1 ≥ -4xThe graph of this last inequality is shown below.
1 + 4x ≥ -4x + 4x
1 + 4x ≥ 0
1 + 4x - 1 ≥ 0 - 1
4x ≥ - 1
4x + 1 ≥ 0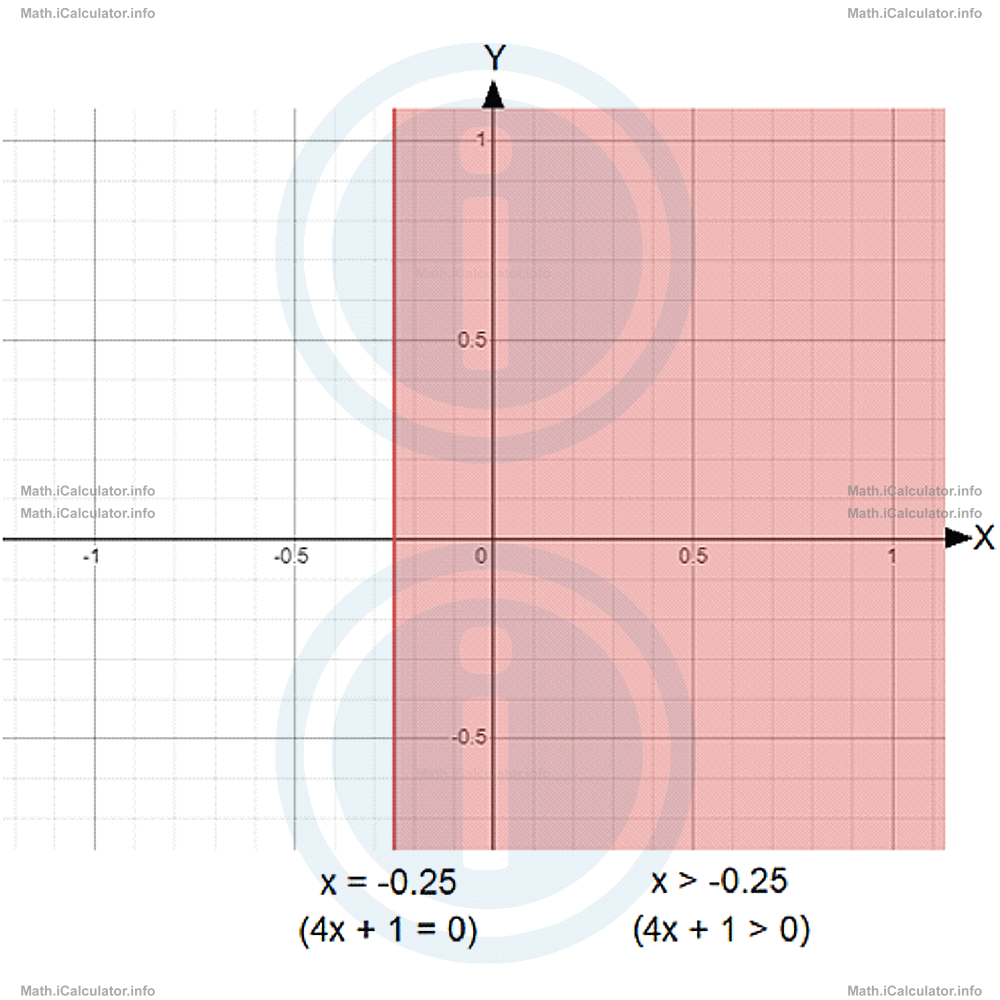 Indeed, if we continued to solve the inequality analytically, we would obtain 4x/4 ≤ -1/4Now, let's pick one value from each interval - from the solution set and outside it - to confirm the correctness of our solution. Let's take for example x = 3, which belongs to the solution set. Obviously, it must be a value that gives a true inequality. We have
x ≤ -1/4
x ≤ -0.251 ≥ -4xOn the other hand, if we pick a number outside the solution set, for example, x = -2, we obtain
1 ≥ - 4 ∙ 3
1 ≥ -12 (true)1 ≥ -4xHence, our solution is already confirmed as correct.
1 ≥ -4 ∙ (-2)
1 ≥ 8 (false) - Again, we write first the given inequality in the standard form. We have -3x ≥ 6Let's make the coefficient a positive to avoid confusion. Thus, multiplying both sides by -1 yields
-3x - 6 ≥ 0(-1)(-3x - 6) ≥ (-1) ∙ 0When this inequality is graphed, we obtain
3x + 6 ≤ 0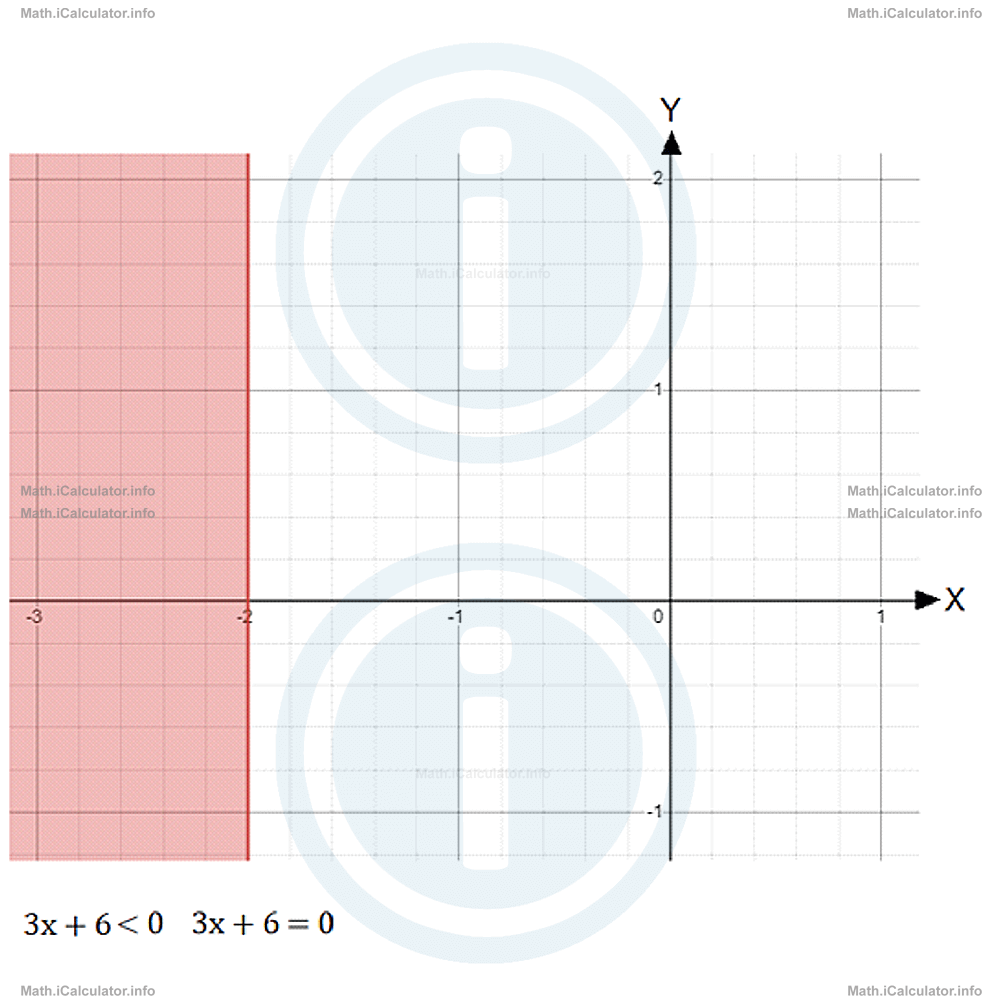 Thus, the part of the coordinate plane that lies on the left of the boundary line x = -2, a line that derives from the solution of the inequality -3x ≥ 6, represents the solution set of this inequality. The boundary line x = -2 is also included in this solution set as the original inequality symbol is " ≥ ", which is a symbol that combines two other symbols in it: " = " and " > ".
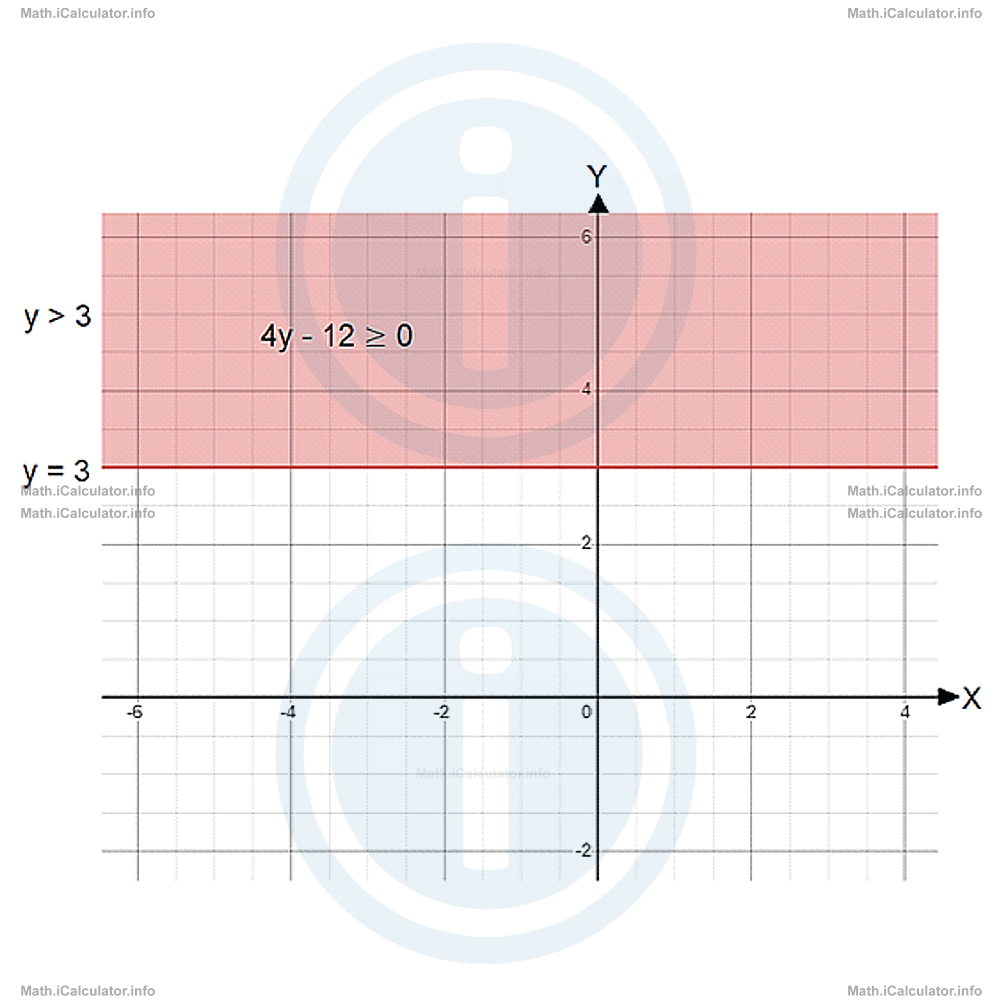
When the variable is not denoted by x but by y, the graph will be horizontal. All the above rules are true except the orientation. Thus, if y > -b/a, the solution set includes the part above the graph without the graph line; if y < -b/a, the solution set includes the part below the graph without the graph line; if y ≥ -b/a, the solution set includes the part above the graph including the graph line as well; and if y ≤ -b/a, the solution set includes the part below the graph as well as the graph line.
For example, the graph of the linear inequality with one variable 4y - 12 ≥ 0 includes the zone above the line y = 3 and the line itself, as a = 4 and b = -12. Thus, since y ≥ -b/a, we have y ≥ - (-12)/4, i.e. y ≥ 3, as shown in the figure below.
More Graphing Inequalities Lessons and Learning Resources
Whats next?
Enjoy the "Graphing First Order Inequalities with One Variable" math lesson? People who liked the "Graphing Inequalities lesson found the following resources useful:
- One Variable Feedback. Helps other - Leave a rating for this one variable (see below)
- Inequalities Math tutorial: Graphing Inequalities. Read the Graphing Inequalities math tutorial and build your math knowledge of Inequalities
- Inequalities Video tutorial: Graphing Inequalities. Watch or listen to the Graphing Inequalities video tutorial, a useful way to help you revise when travelling to and from school/college
- Inequalities Revision Notes: Graphing Inequalities. Print the notes so you can revise the key points covered in the math tutorial for Graphing Inequalities
- Inequalities Practice Questions: Graphing Inequalities. Test and improve your knowledge of Graphing Inequalities with example questins and answers
- Check your calculations for Inequalities questions with our excellent Inequalities calculators which contain full equations and calculations clearly displayed line by line. See the Inequalities Calculators by iCalculator™ below.
- Continuing learning inequalities - read our next math tutorial: Systems of Inequalities
Help others Learning Math just like you
Please provide a rating, it takes seconds and helps us to keep this resource free for all to use
We hope you found this Math tutorial "Graphing Inequalities" useful. If you did it would be great if you could spare the time to rate this math tutorial (simply click on the number of stars that match your assessment of this math learning aide) and/or share on social media, this helps us identify popular tutorials and calculators and expand our free learning resources to support our users around the world have free access to expand their knowledge of math and other disciplines.