Menu
Math Lesson 10.3.4 - Graphing Second-Order Inequalities
Please provide a rating, it takes seconds and helps us to keep this resource free for all to use
Welcome to our Math lesson on Graphing Second-Order Inequalities, this is the fourth lesson of our suite of math lessons covering the topic of Graphing Inequalities, you can find links to the other lessons within this tutorial and access additional Math learning resources below this lesson.
Graphing Second-Order Inequalities
As we have explained in the previous tutorials, a second-order equation is an extension of the concept of quadratic equations including a new variable y. This means the quadratic equation
is a special case of the second-order equation with two variables
where y = 0. The line that represents the graph of second-order equations with two variables is not straight; this line is called a parabola. For example, the graph of the second-order equation with two variables y = x2 + 3x - 4 is shown in the figure below.
Following the same reasoning used in the previous paragraphs on graphing the other types of inequalities, it is clear that if a second-order equation is expressed in the standard form as the one shown above, the following rules are true for the four corresponding inequalities (the condition is that a > 0):
- The solution set of the inequality y > ax2 + bx + c includes the zone above the graph (parabola) but not the graph line.
- The solution set of the inequality y < ax2 + bx + c includes the zone under the graph (parabola) but not the graph line.
- The solution set of the inequality y ≥ ax2 + bx + c includes the zone above the graph (parabola) as well as the graph line.
- The solution set of the inequality y ≤ ax2 + bx + c includes the zone under the graph (parabola) as well as the graph line.
Let's clarify this point through an example.
Example 4
Solve graphically the following inequalities.
- 2x2 - y + 3 < 5x
- 2y - x - 4 ≤ 5x2
Solution 4
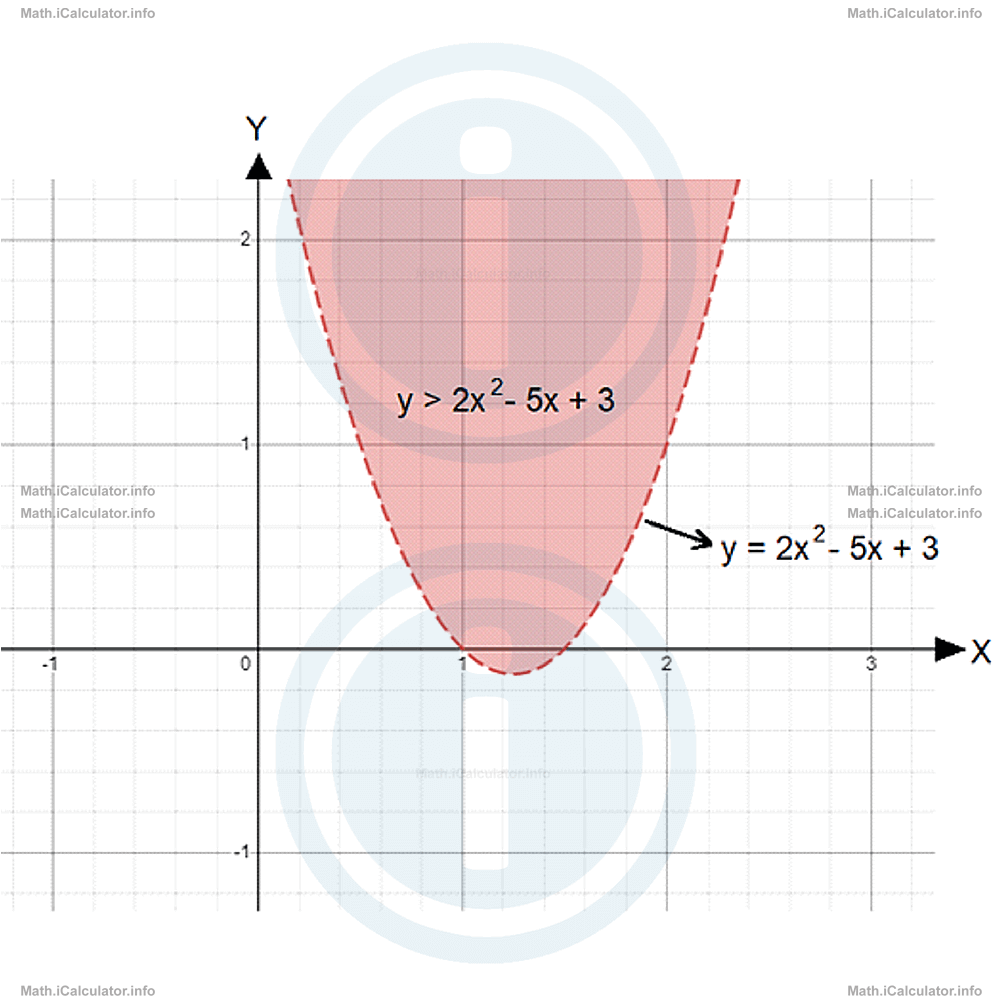
- First, we must turn the given inequality in the form y (?) ax2 + bx + c, where (?) represents one of the four inequality symbols. We have 2x2 - y + 3 < 5xLooking at the above inequality from right to left yields
2x2 - 5x + 3 < yy > 2x2 - 5x + 3Since the graph is not linear anymore, we need more than two points to plot it. The more points we consider, the more accurate the graph is. We will not dwell too much on this point, as in the upcoming chapters we will explain extensively how to find some special points contained on a parabola that help us plot the graph easier. However, we anticipate that a parabola graph is plotted by joining at least four special points:
- The two x-intercepts A and B that have the vertical (y) coordinate zero (they are obtained by solving the corresponding quadratic graph ax2 + bx + c = 0, as the x-intercepts represent the x-coordinate of the roots). Thus, we have A(x1, 0) and B(x2, 0);
- The y-intercept C(0, y) that is obtained by taking x = 0 in the corresponding quadratic equation; and
- The vertex V of the parabola, represents the minimum or maximum point of the parabola. It has the coordinates V(-b/2a, -Δ/4a), where Δ is the discriminant of the corresponding quadratic equation.
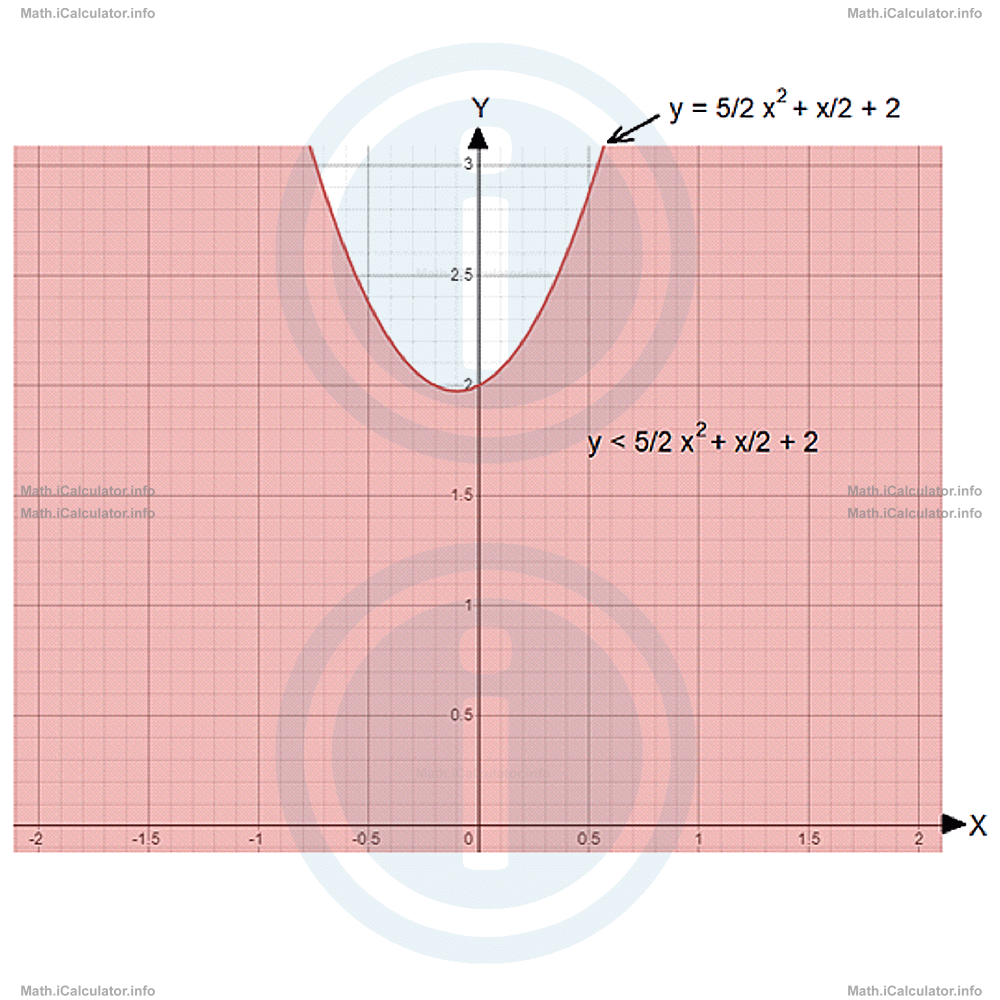
- Here again, we must turn the given inequality in the form y (?) ax2 + bx + c. We have 2y - x - 4 ≤ 5x2or
2y ≤ 5x2 + x + 4
2y/2 ≤ 5x2/2 + x/2 + 4/2
y ≤ 5x2/2 + x/2 + 2y ≤ 5/2 x2 + 1/2 x + 2Applying the procedure described in (a) for the graph plotting, we obtain the following graph, which includes the region below the parabola as well as the parabola itself, because the sign of the inequality is " ≤ ".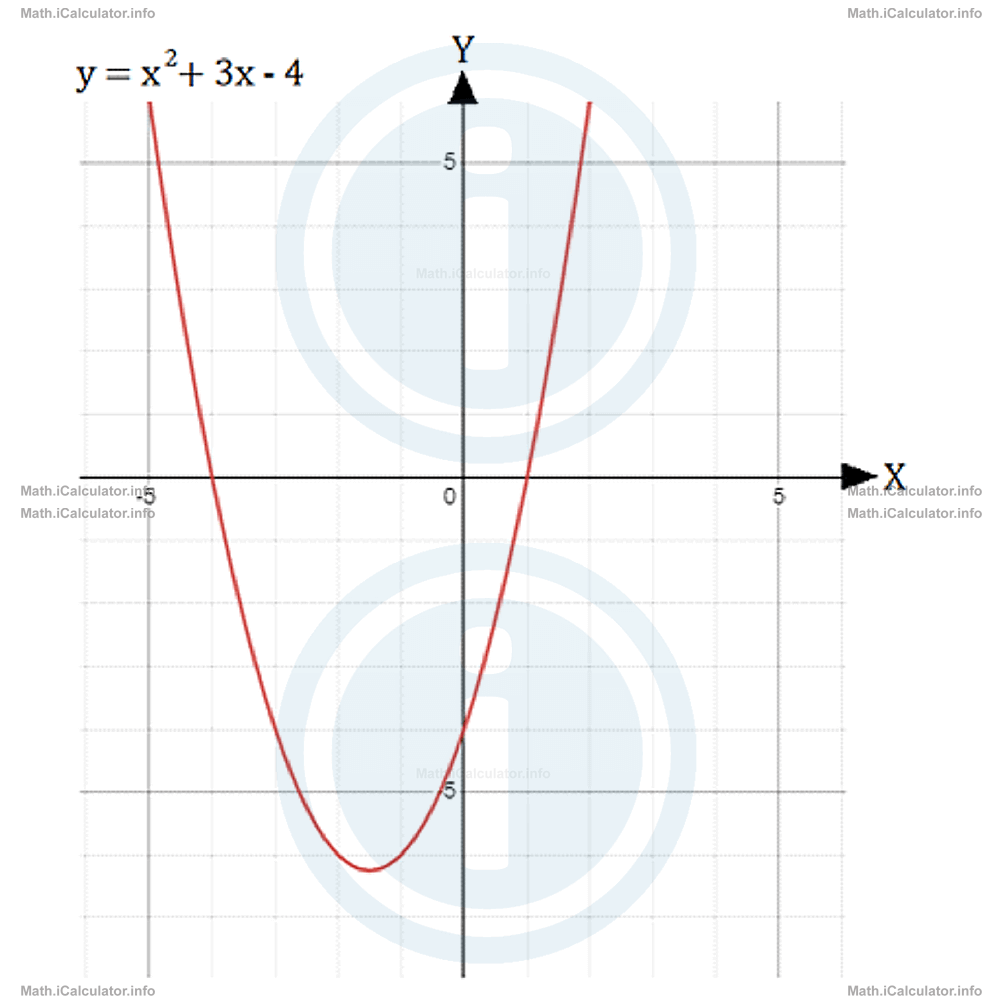
More Graphing Inequalities Lessons and Learning Resources
Whats next?
Enjoy the "Graphing Second-Order Inequalities" math lesson? People who liked the "Graphing Inequalities lesson found the following resources useful:
- Second Order Feedback. Helps other - Leave a rating for this second order (see below)
- Inequalities Math tutorial: Graphing Inequalities. Read the Graphing Inequalities math tutorial and build your math knowledge of Inequalities
- Inequalities Video tutorial: Graphing Inequalities. Watch or listen to the Graphing Inequalities video tutorial, a useful way to help you revise when travelling to and from school/college
- Inequalities Revision Notes: Graphing Inequalities. Print the notes so you can revise the key points covered in the math tutorial for Graphing Inequalities
- Inequalities Practice Questions: Graphing Inequalities. Test and improve your knowledge of Graphing Inequalities with example questins and answers
- Check your calculations for Inequalities questions with our excellent Inequalities calculators which contain full equations and calculations clearly displayed line by line. See the Inequalities Calculators by iCalculator™ below.
- Continuing learning inequalities - read our next math tutorial: Systems of Inequalities
Help others Learning Math just like you
Please provide a rating, it takes seconds and helps us to keep this resource free for all to use
We hope you found this Math tutorial "Graphing Inequalities" useful. If you did it would be great if you could spare the time to rate this math tutorial (simply click on the number of stars that match your assessment of this math learning aide) and/or share on social media, this helps us identify popular tutorials and calculators and expand our free learning resources to support our users around the world have free access to expand their knowledge of math and other disciplines.