Menu
Math Lesson 4.1.4 - Part : Whole vs Part : Part Ratios
Please provide a rating, it takes seconds and helps us to keep this resource free for all to use
Welcome to our Math lesson on Part : Whole vs Part : Part Ratios, this is the fourth lesson of our suite of math lessons covering the topic of Ratios, you can find links to the other lessons within this tutorial and access additional Math learning resources below this lesson.
Part : Whole vs Part : Part Ratios
We will use another example to illustrate the difference between these two types of ratios.
Example 7:
A company has 120 employees where 45 are male and 3/5 of female employees have attended university.
- What part of the staff are female?
- How many women from the staff have attended university?
- What part of the staff are female employees who have attended university?
- What is the maximum number of groups that can be formed by preserving the same gender and education structure of the whole staff?
Solution 7
- The number of female workers in the company is 120 - 45 = 75. This number makes Female∶Total = 75∶120
= 75/120
= 75 ÷ 15/120 ÷ 15
= 5/8 of the staff - We have 3 out of 5 women from the staff who have attended university. Thus, the total number of female staff Nfu who have attended university is Nfu = 3/5 of 75
= 3/5 × 75
= 3 × 75/5
= 45 women - The above number divided by the total gives the part of the staff that are both female employee and have attended university. Thus, R(Nfu ) = Nfu/Ntot
= 45/120
= 45 ÷ 15/120 ÷ 15
= 3/8 of the staff - The number of male employees is also 45. This number makes 3/8 of the staff, as found above. Therefore, a group of 8 people must contain 5 women (where 3 of them have attended university) and 3 men. This is the smallest group we can form by preserving the original structure of the company staff. Therefore, the maximum number of groups possible is Ngroups = 120 employees/8 employees/group
= 15 groups
Scaling Up Ratios
We can use the ratio between two or more quantities given in the simplest form to find other equivalent ratios, this can help us find the number of elements in a group. We saw this property when explaining ratios expressed in a number line, where we could find other ratios besides the required one by looking which numbers were aligned vertically. This time however, we can use not two horizontal separate axes placed one under the other but two perpendicular axes instead, which allows us to draw a straight line which gives all possible relationships between the quantities involved through a straight line drawn from the origin.
The advantage of this method known as scaling up ratios consists in the fact that we can obtain a larger number of possible combinations between the quantities involved, which follow the rule given in the ratio. However, it also has a disadvantage: we cannot include more than three quantities in the calculations, as the maximum number of axes we can use is three (the space is 3D).
From algebra, it is known that if two quantities (we often call them "variables", as the values of one quantity affect the corresponding values of the other) are in a constant ratio, the line that shows all possible relations of the two quantities (we call it the "graph" of relation), is linear. The best feature of this method consists on the need for only two corresponding values; one for each quantity. These values act like coordinates of the graph, expressed by number pairs. Then, we can draw a straight line that connects the origin and the given point expressed by the above values (coordinates). This line can be extended further in that direction to obtain other pairs of numbers.
It is better to have the ratio expressed in this form plotted in a millimetre paper, as in the example below.
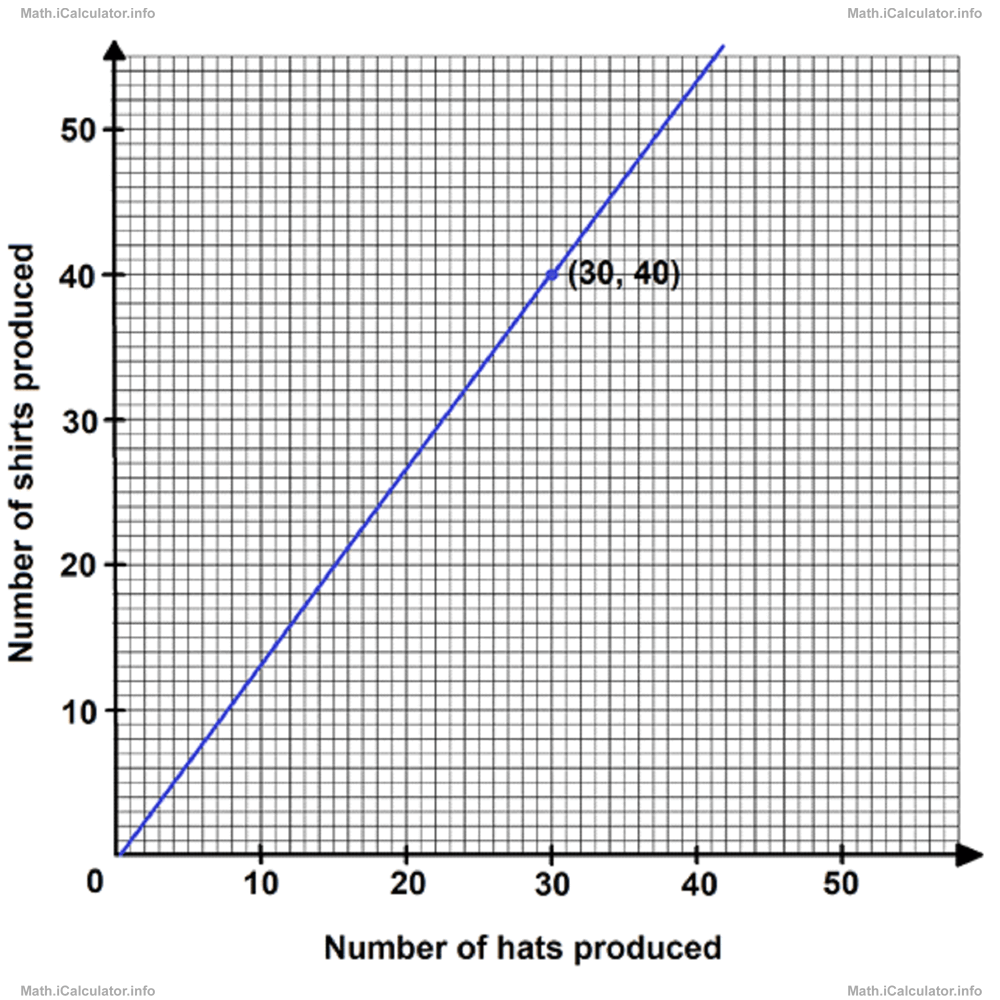
Example 8
A factory produces hats and shirts in the ratio 3:4.
- Plot a graph to show this relationship
- From the graph, find the number of shirts produced for every 21 hats
- Again, use the graph to find the number of hats produced for every 24 shirts
Solution 8
- We express the hats on the horizontal axis and shirts on the vertical one - all this in a millimetre paper, as the one shown below. Since for every 3 hats we have 4 shirts produced, then for every 30 hats there are 40 shirts produced. In this way, we use the pair (30, 40) as a reference for our graph (which starts from the origin). Then, we continue further in that direction.
- If we look at the graph carefully, we notice that for 21 hats there are 28 shirts produced. This is because the point (21, 28) is a point of the graph.
- Again, by observing the graph carefully, we notice that for 24 shirts, there are 18 hats produced. This is because the point (18, 24) is also a point of the graph.
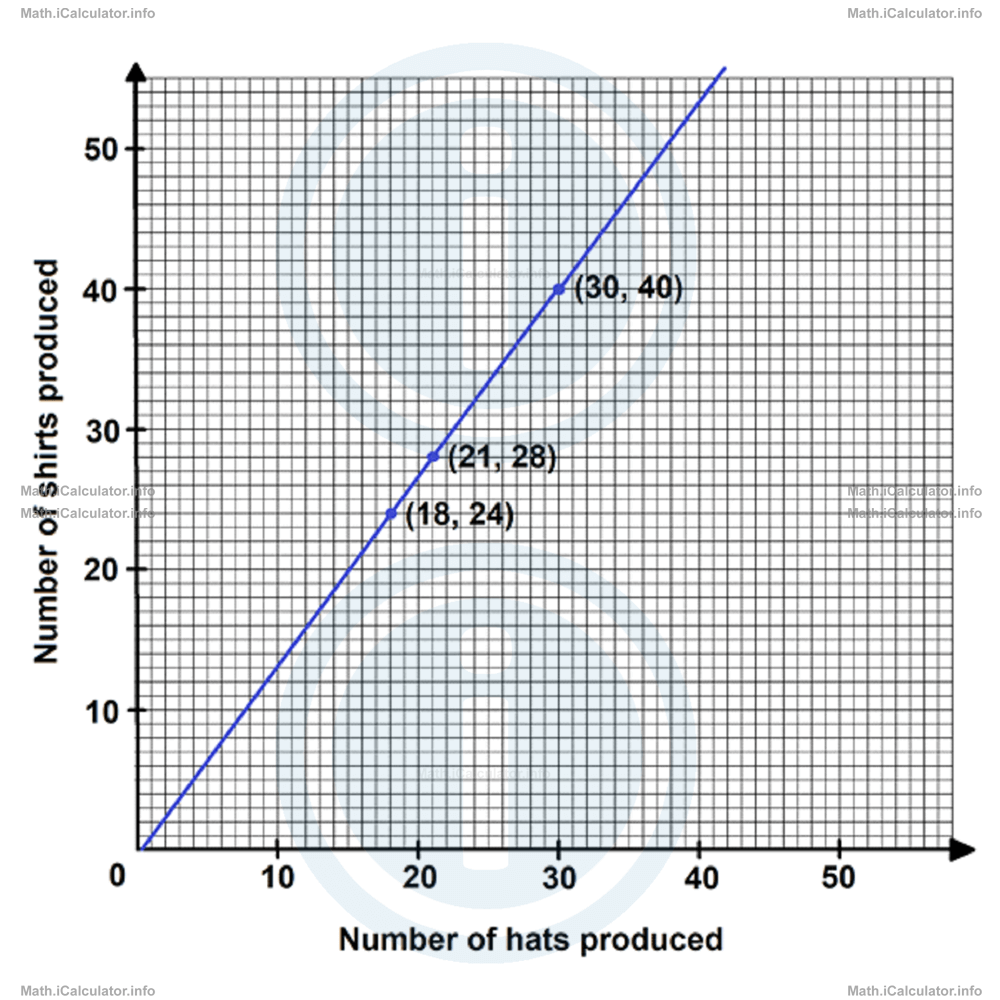 As you see, if we have the graph of a ratio plotted, no further calculations are necessary; we can find all values needed by looking at the graph.
More Ratios Lessons and Learning Resources
Whats next?
Enjoy the "Part : Whole vs Part : Part Ratios" math lesson? People who liked the "Ratios lesson found the following resources useful:
- Whole Part Feedback. Helps other - Leave a rating for this whole part (see below)
- Ratio and Proportion Math tutorial: Ratios. Read the Ratios math tutorial and build your math knowledge of Ratio and Proportion
- Ratio and Proportion Video tutorial: Ratios. Watch or listen to the Ratios video tutorial, a useful way to help you revise when travelling to and from school/college
- Ratio and Proportion Revision Notes: Ratios. Print the notes so you can revise the key points covered in the math tutorial for Ratios
- Ratio and Proportion Practice Questions: Ratios. Test and improve your knowledge of Ratios with example questins and answers
- Check your calculations for Ratio and Proportion questions with our excellent Ratio and Proportion calculators which contain full equations and calculations clearly displayed line by line. See the Ratio and Proportion Calculators by iCalculator™ below.
- Continuing learning ratio and proportion - read our next math tutorial: Rates. Applications of Ratios and Rates in Practice
Help others Learning Math just like you
Please provide a rating, it takes seconds and helps us to keep this resource free for all to use
We hope you found this Math tutorial "Ratios" useful. If you did it would be great if you could spare the time to rate this math tutorial (simply click on the number of stars that match your assessment of this math learning aide) and/or share on social media, this helps us identify popular tutorials and calculators and expand our free learning resources to support our users around the world have free access to expand their knowledge of math and other disciplines.
Ratio and Proportion Calculators by iCalculator™
- Geometric Mean Calculator
- Joint Variation Calculator
- Ratio Calculator
- Ratio Solver
- Ratio Addition Calculator
- Ratio Subtraction Calculator
- Ratio Division Calculator
- Ratio Multiplication Calculator
- Relative Ratios Calculator
- Ratio Comparison Calculator
- Visual Ratio Calculator
- Ratio Finder
- Equivalent Ratios Calculator
- Equivalent Ratio Table Calculator
- Aspect Ratio Calculator
- Divide Ratio Calculator
- Ratio Divider Calculator
- Ratio Simplifier Calculator
- Golden Ratio Calculator
- 3 Ratio Calculator
- Sharing Ratio Calculator
- Equal Share Verse Ratio Share Calculator
- Values To Ratio Calculator
- Ratio Table Calculator
- Ratio Table
- Decimal Ratio Table Calculator
- Ratio Table Creator
- Ratio Converter
- Percentage To Ratio Calculator
- Ratio To Percentage Calculator
- Ratio To Fraction Calculator
- Fraction To Ratio Calculator
- Ratio To Decimal Calculator
- Decimal To Ratio Calculator
- Values To Ratio Calculator
- Which Ratio Or Fraction Is Bigger
- Which Ratio Or Percentage Is Bigger
- Which Ratio Is Bigger